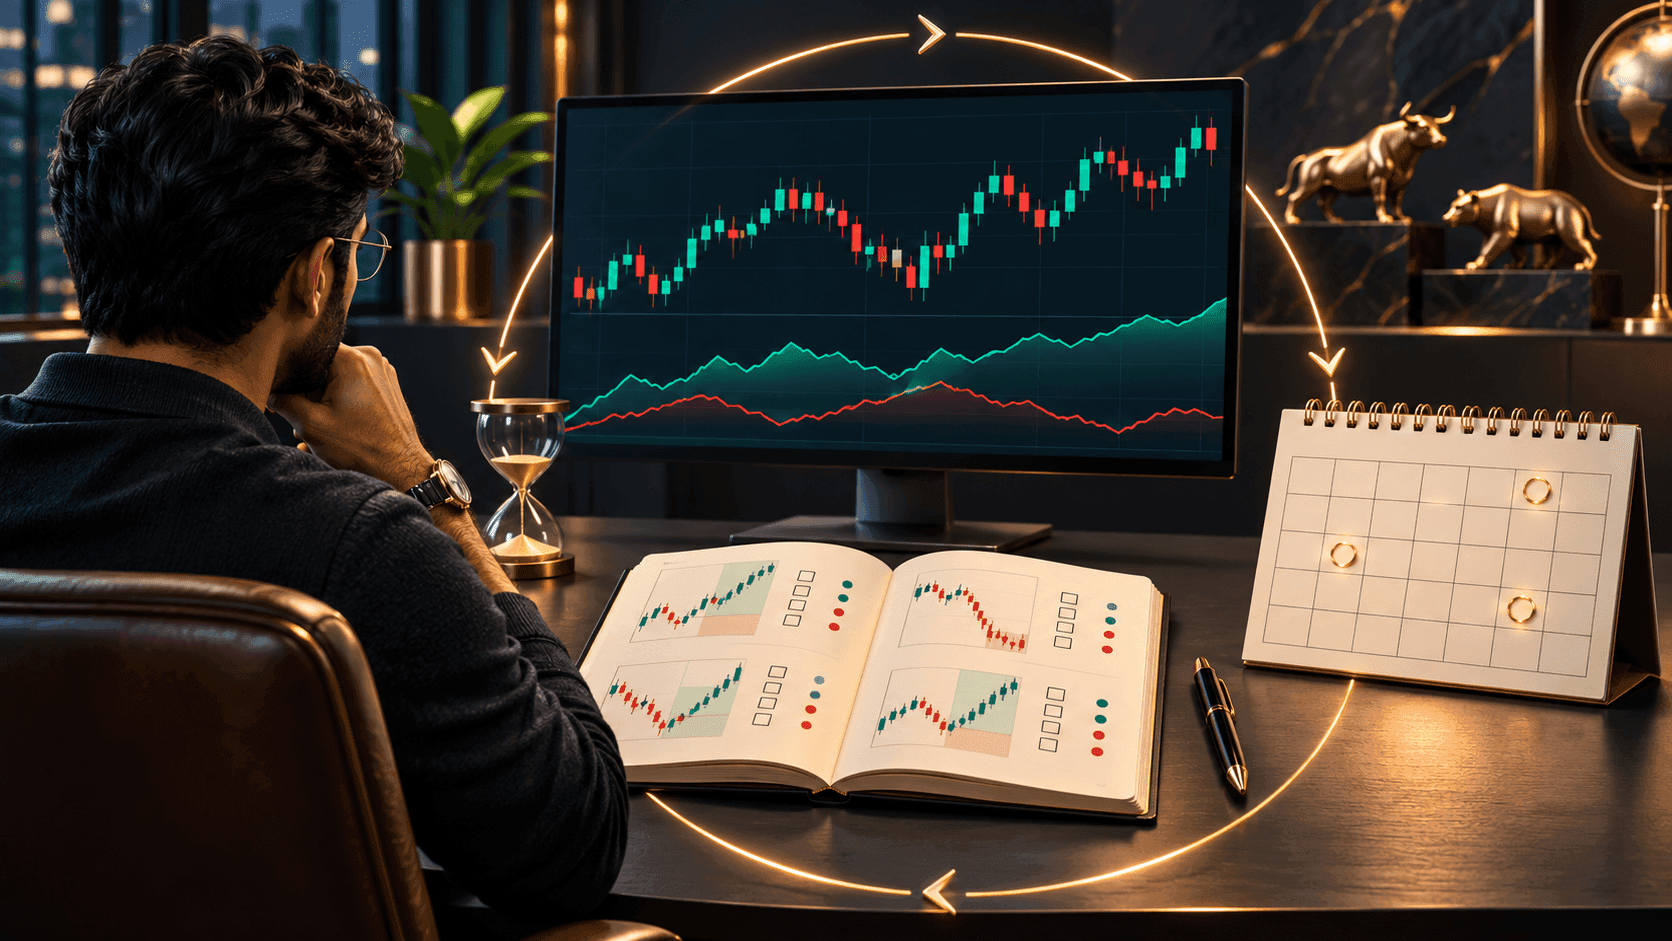


In the high-speed world of global markets, information overload is a real threat. Whether you are trading Forex, Indices, or Commodities, the sheer volume of data flashing across your screen can lead to "analysis paralysis."
You have likely been there: staring at a chart cluttered with a dozen indicators, moving averages, and oscillators, trying to find a signal amidst the noise.
But here is the truth experienced traders know: Clarity equals speed.
The most effective way to improve your reaction time and decision-making isn't by adding more data—it's by simplifying what you see using basic visual cues.
The Brain Processes Visuals 60,000 Times Faster Than Text
When you are trading volatile assets like Gold or the US100, every second counts. Your brain is wired to recognize shapes and colors instantly, whereas interpreting raw numbers requires cognitive load.
By using simple visual cues on your charts, you transform raw data into actionable intelligence.
Top 3 Visual Cues to Implement Today
If you are using robust platforms like MetaTrader 5 (MT5)—which we proudly offer at My Maa Markets—you have a suite of drawing tools at your fingertips. Here is how to use them effectively:
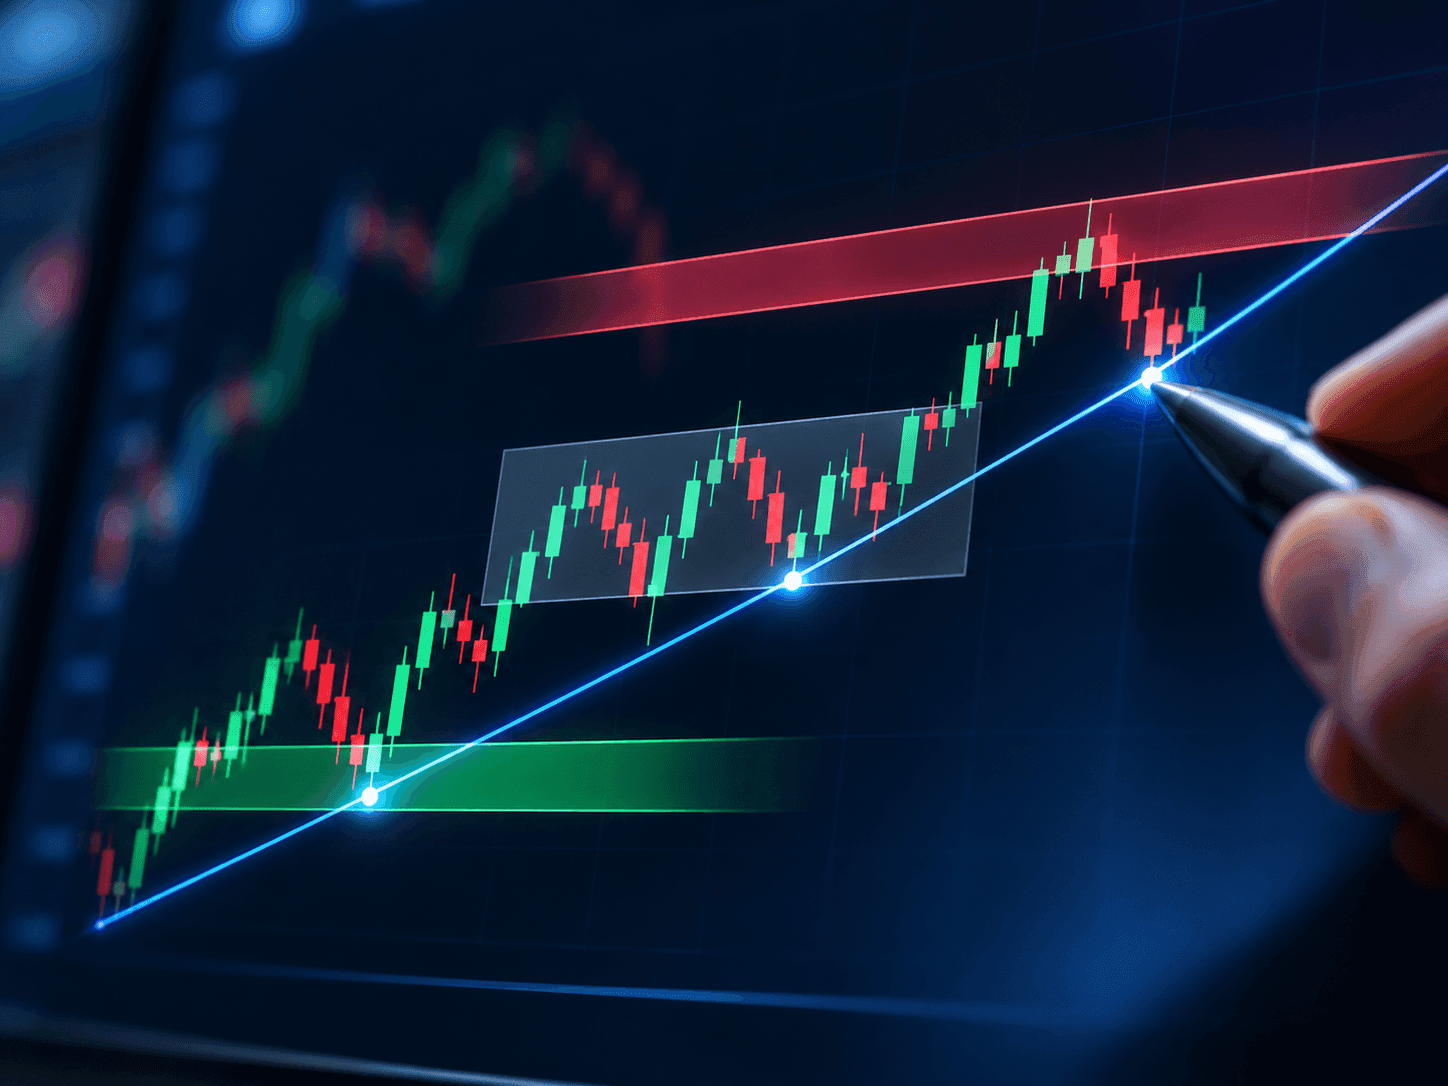
- Zone Boxes instead of Single Lines: Support and resistance are rarely exact numbers; they are zones.
The Fix: Use the rectangle tool to draw shaded zones. If price enters the "Red Zone," you look for shorts. If it enters the "Green Zone," you look for longs. This removes the stress of waiting for a specific pip.
- Color-Coded Trendlines: Don't just draw lines; give them meaning.
The Fix: Use blue lines for major timeframe trends (Daily/Weekly) and orange lines for minor trends (1-Hour). This allows you to instantly see if you are trading with the current or against the tide.
- The "No-Trade" Gray Area:
The Fix: If the market is ranging or consolidating, shade that area in gray. This serves as a visual "Stop" sign, reminding you to sit on your hands until the market picks a direction.
Reducing Emotional Trading Through Visualization
The biggest benefit of visual cues isn't just aesthetic—it is psychological.
When you mark up your chart with clear visual boundaries, you are pre-committing to a plan. You are telling yourself: "I will only act when the price interacts with this specific visual element."
This simple discipline helps curb impulsive decisions and keeps you focused on your strategy, rather than the emotions of the minute-by-minute candle fluctuations.
Your Charts, Your Way
At My Maa Markets, we understand that no two traders view the market exactly the same way. That is why we provide the tools you need to customize your trading environment.
Whether you are a scalper needing clean, minimal charts for quick execution, or a swing trader needing detailed markups, our MT5 platform supports your style.
-
Advanced Charting: fully customizable to your visual preferences.
-
Institutional Grade Execution: so your trade executes exactly when your visual cue is triggered.
-
3000+ Instruments: apply your visual strategies across Forex, Crypto, Stocks, and more.
Ready to Visualize Your Success?
Simplicity is the ultimate sophistication in trading. By decluttering your charts and relying on clear visual cues, you can trade with greater confidence and less stress.
We want to hear from you: What is the one visual tool or indicator you cannot trade without? Let us know in the comments below! 👇
Take the Next Step
Experience the difference of trading on a platform designed for clarity and performance. Open a Demo Account with My Maa Markets today and practice setting up your charts risk-free.
Disclaimer: Trading involves significant risk and may not be suitable for all investors. You should carefully consider your investment objectives, experience level, and risk appetite. Only invest money you can afford to lose.