Your stop-loss was not hit by bad luck. It was hit because it was exactly where everyone else's stop was and that made it the most valuable location on the entire chart.
Imagine you run a small shop and you need to buy 10,000 chairs before Friday. There is only one place in your city that sells chairs. You cannot show up, announce what you need, and expect a fair price, the moment the seller knows your situation, the price goes up. So instead, you wait for their slow days. You spread the purchases across several visits. You buy quietly, in volume, precisely when no one is watching. Now scale that logic to a trillion-dollar market, replace the chairs with currency, and you have just understood why stop hunts exist.
The market does not target your stop because anyone is out to get you personally. It targets your stop because your stop along with thousands of identical stops placed by traders who read the same chart and reached the same conclusion creates the only place in the market with enough resting liquidity to fill an order that large. This is not malice. It is mechanics.
The, Anatomy of a stop hunt
How the sequence actually unfolds, step by step
-
Price establishes a clear swing high or low something visible, obvious, the kind of level every retail trader marks on their chart within minutes of it forming.
-
Traders go short from that high (or long from that low) and place their stops just beyond it the textbook location, the "safe" distance taught in every trading course.
-
Those stops accumulate. Hundreds of traders, same level, same logic. To an institution reading order flow, this cluster becomes visible as a dense pool of pending buy orders sitting above the high (stops on short positions are buy orders).
-
An institution that wants to sell in size needs buyers on the other side of that trade. It engineers a move into that stop cluster, triggers the buy orders, and uses them to fill its sell position at the inflated price.
-
Price reverses sharply. The institution is now positioned short of a premium level, filled with liquidity it could not have found anywhere else on the chart. Retail traders watch their stopped-out trade reverse in the direction they originally had it.
The cruelest part is not losing the trade. The cruelest part is being correct about direction and still losing, because the entry and stop placement telegraphed exactly where the trap needed to be set.
"Being right about where price is going and still getting stopped out is not a streak of bad luck. It is a structural problem, and it has a structural solution."
The obvious levels that get hunted share a pattern. They cluster around the same four locations on almost every chart, in every timeframe, in every pair.
Where stop hunts happen most
The four locations that attract institutional targeting
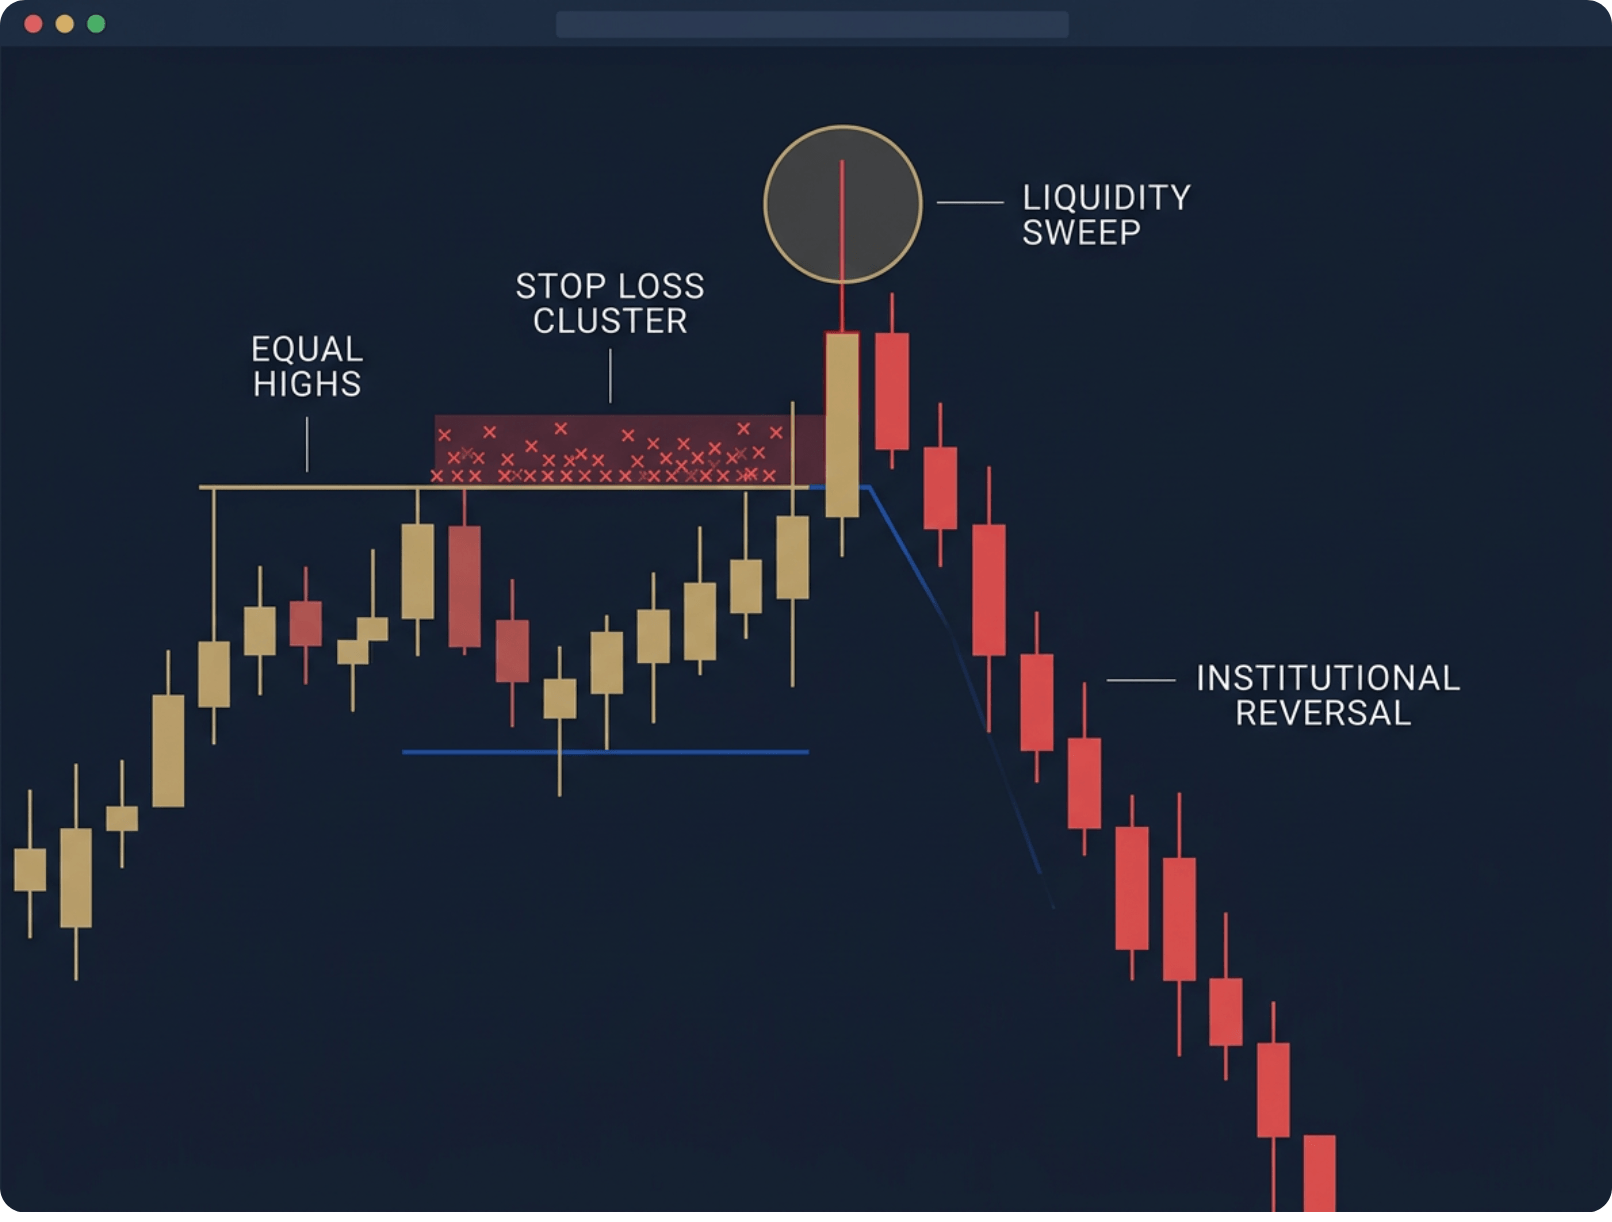
Equal highs and equal lows, two or more swing points that touched roughly the same price level. These are stop magnets. Every trader who shorted from the second high placed a stop just above the first. The cluster is enormous and perfectly predictable.
Round numbers 1.1000, 1.2500, 150.00 on USD/JPY. Retail psychology gravitates to clean numbers. Stops cluster there. Institutions know this and routinely push price through round levels before reversing.
Previous day's high and low widely watched by algorithmic systems and manual traders alike. A break of the previous day's high that immediately fails and reverses is a textbook liquidity grab on a daily structure level.
The wicks of large candles that long shadow on a daily candle pointing upward represent a previous stop hunt. Price went there once, triggered orders, and reversed. When price approaches that wick high again, another round of stops sits there, and the probability of another hunt increases significantly.
A trader is short EUR/USD from 1.0950, stop at 1.0975 just above the prior swing high. At 8:15 AM London time, price spikes to 1.0978. The stop triggers. The trader is out. By 9:00 AM, EUR/USD is trading at 1.0910. The trade that was right about direction, entered at a sensible level, was killed by 3 pips of overshoot 3 pips that existed specifically to clear that stop before the real move began. This is not a story. It happens every day, in every liquid pair, on every timeframe. Recognizing the hunt is one thing. Trading around it is another.
The difference between the two is understanding what a stop hunt looks like after it happens versus before you place your order.
Sweep vs. real break: how to read the difference
Liquidity sweep
Price pierces the level briefly, often by just a few pips, then closes back inside the range within the same candle or the next. Volume spikes on the wick, not on the body. No follow-through beyond the level.
Real breakout
Price breaks the level, consolidates above or below it, and then continues. Candle bodies close beyond the level, not just wicks. Multiple candles hold the break. Volume stays elevated after the move, not just during it.
The practical adjustment is not complicated, though it requires patience that most traders find uncomfortable. Instead of entering the moment price bounces off a support level, wait for the sweep. Let price break that level, hunt the stops sitting below it, and then watch for a sharp reversal back above. That reversal after the liquidity has been taken is the institutional entry signal. The stop now sits below the sweep low, in genuinely clean space, where no logical reason exists for price to return.
You are no longer the hunted. You are entering after the hunt is over, positioned in the same direction as the institution that just used everyone else's stop to fill its order. That is a different trade entirely same chart, same pair, same direction, entirely different outcome.
The market does not hunt stops out of cruelty. It hunts them out of necessity. The sooner that distinction settles, the sooner the chart starts making sense.


