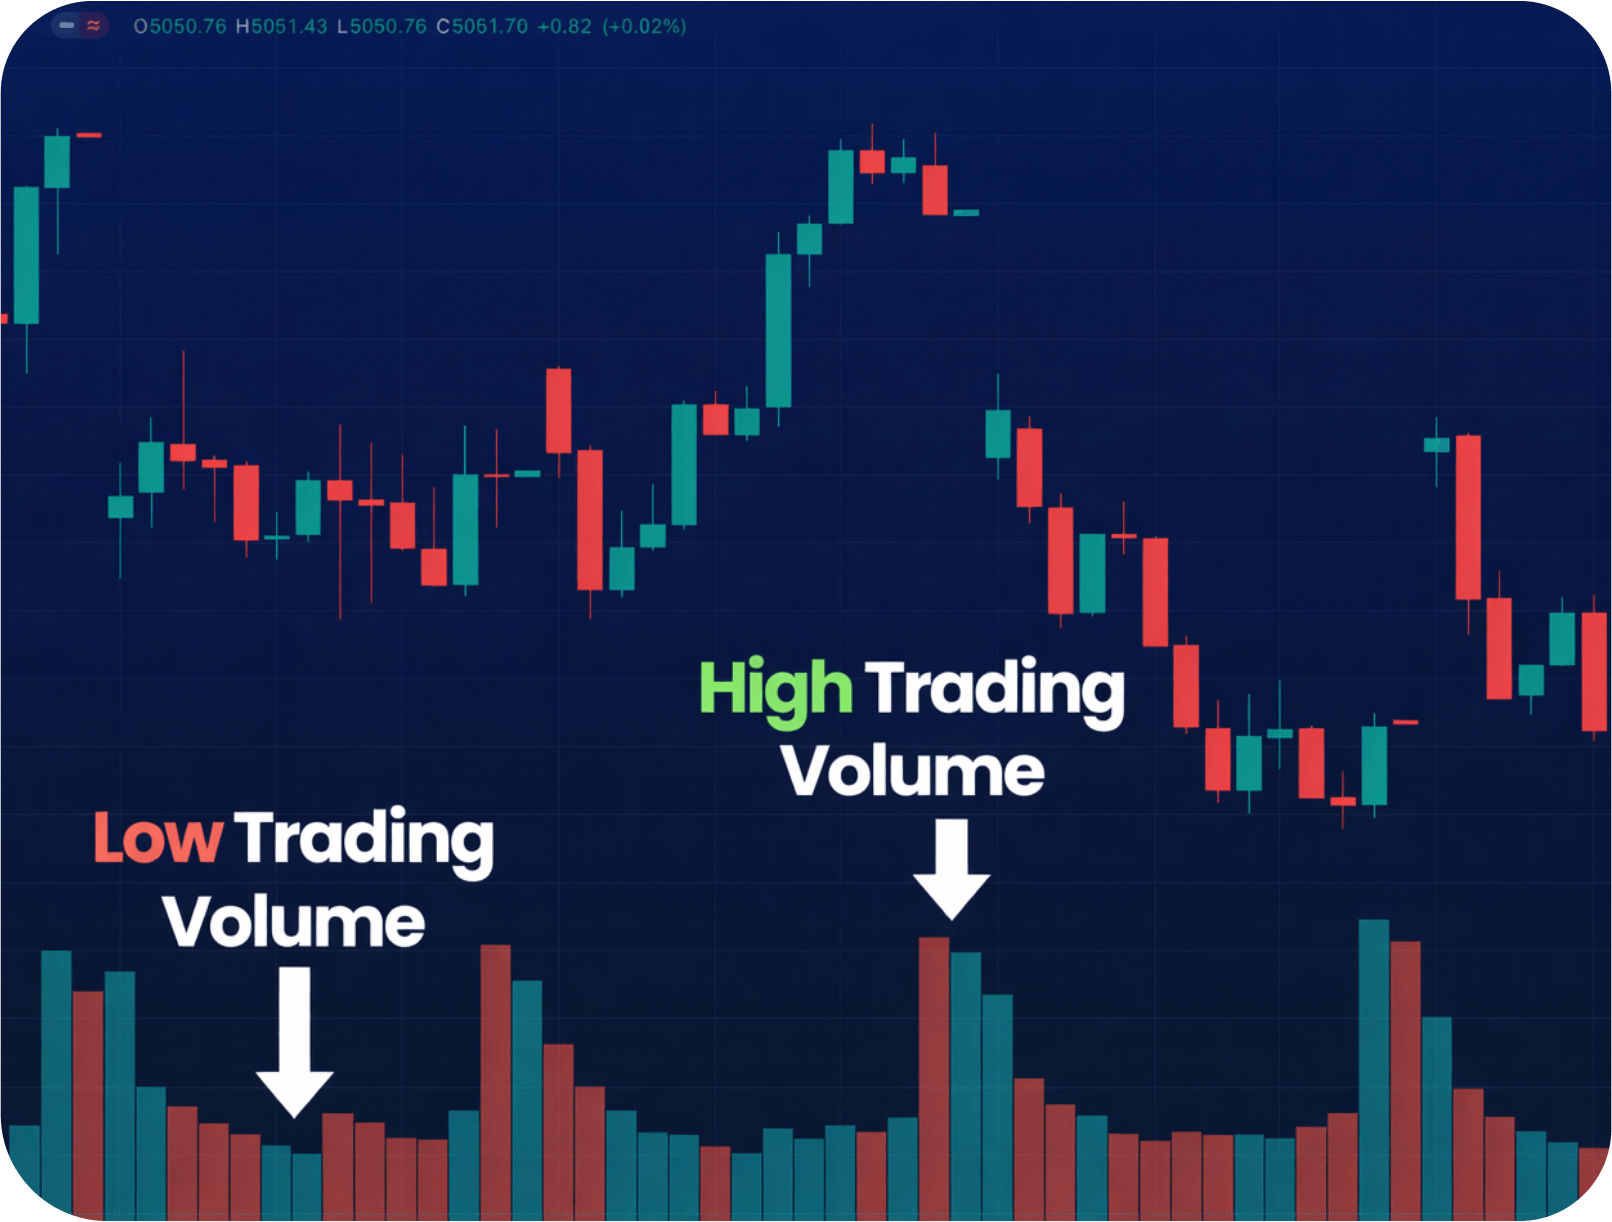
Volume is the fuel that drives the market. While price tells you what the market is doing, volume tells you how strong the move is. For traders looking to validate trends and spot potential reversals, understanding volume is just as crucial as tracking price action.
By analysing the number of shares or contracts traded within a specific timeframe, volume indicators provide a deeper look into market sentiment. Whether you are scalping the markets or holding long-term positions, incorporating these tools into your strategy can help you distinguish between a genuine breakout and a false signal.
In this guide, we explore the top volume indicators, how to interpret them, and how they can enhance your trading decisions on the My Maa Markets platform.
1. On-Balance Volume (OBV)
On-Balance Volume (OBV) is a momentum indicator that uses volume flow to predict changes in stock price. The concept is simple: volume precedes price. OBV adds volume on up-days and subtracts volume on down-days to create a running total.
When the OBV is rising, it indicates that volume is increasing on price upswings, suggesting positive buying pressure. Conversely, a falling OBV suggests selling pressure. Traders often look for divergence between OBV and price. For instance, if the price continues to rise but OBV starts to flatten or fall, the upward trend may be losing momentum, signalling a potential reversal.
2. Volume Price Trend (VPT)
Similar to OBV, the Volume Price Trend (VPT) indicator combines price and volume to determine the strength of a price trend. However, unlike OBV, which treats every up or down day equally regardless of the price change magnitude, VPT takes into account the percentage increase or decrease in price.
VPT is calculated by multiplying the trading volume by the percentage change in the price trend. This makes it particularly useful for spotting the relationship between price shifts and volume. If the price is moving upwards but the VPT is not making new highs, this divergence can serve as a warning sign that the trend is weak and might not be sustainable.
3. Accumulation/Distribution Line (A/D)
The Accumulation/Distribution (A/D) Line assesses the supply and demand of an asset by looking at where the price closes within its range for the period, then multiplying that by volume. It helps traders determine if an asset is being accumulated (bought) or distributed (sold).
When the A/D line is trending upward, it suggests that there is buying pressure, as the asset is closing near the high of its daily range on high volume. A downward trend indicates selling pressure. This indicator is powerful for confirming the strength of a trend; a rising price supported by a rising A/D line is a strong bullish signal, whereas a rising price with a falling A/D line indicates underlying weakness.
Real-World Strategies and Interpretation
Interpreting these indicators requires looking beyond the lines on the chart. A common strategy involves using volume indicators to confirm breakouts. For example, if a stock price breaks above a resistance level, you would want to see a corresponding spike in the On-Balance Volume or VPT to confirm that big players are supporting the move.
Another strategy is spotting divergence. If the price of an asset reaches a new high but the Accumulation/Distribution line fails to do so, it suggests that the volume does not support the price, often preceding a price correction. By combining these volume insights with price action on our advanced MT5 platform, traders can make more informed entry and exit decisions.
Important Risk Disclosure
While indicators are valuable tools, trading involves significant risk. CFDs and Margin FX are leveraged products that carry a high level of risk to your capital. Trading is not suitable for everyone and may result in you losing substantially more than your initial investment. You do not own, or have any right to the underlying assets. You should only trade with money you can afford to lose.
Conclusion
Volume indicators offer a vital layer of depth to market analysis, helping traders see the strength behind price movements. By mastering tools like OBV, VPT, and the A/D Line, you can better identify trends and potential reversals.
At My Maa Markets, we are committed to empowering your trading journey with the right tools and knowledge. Our platform offers advanced charting capabilities to help you apply these indicators effectively. Ready to test these strategies? Open an account today to access global markets with competitive spreads and expert support.


