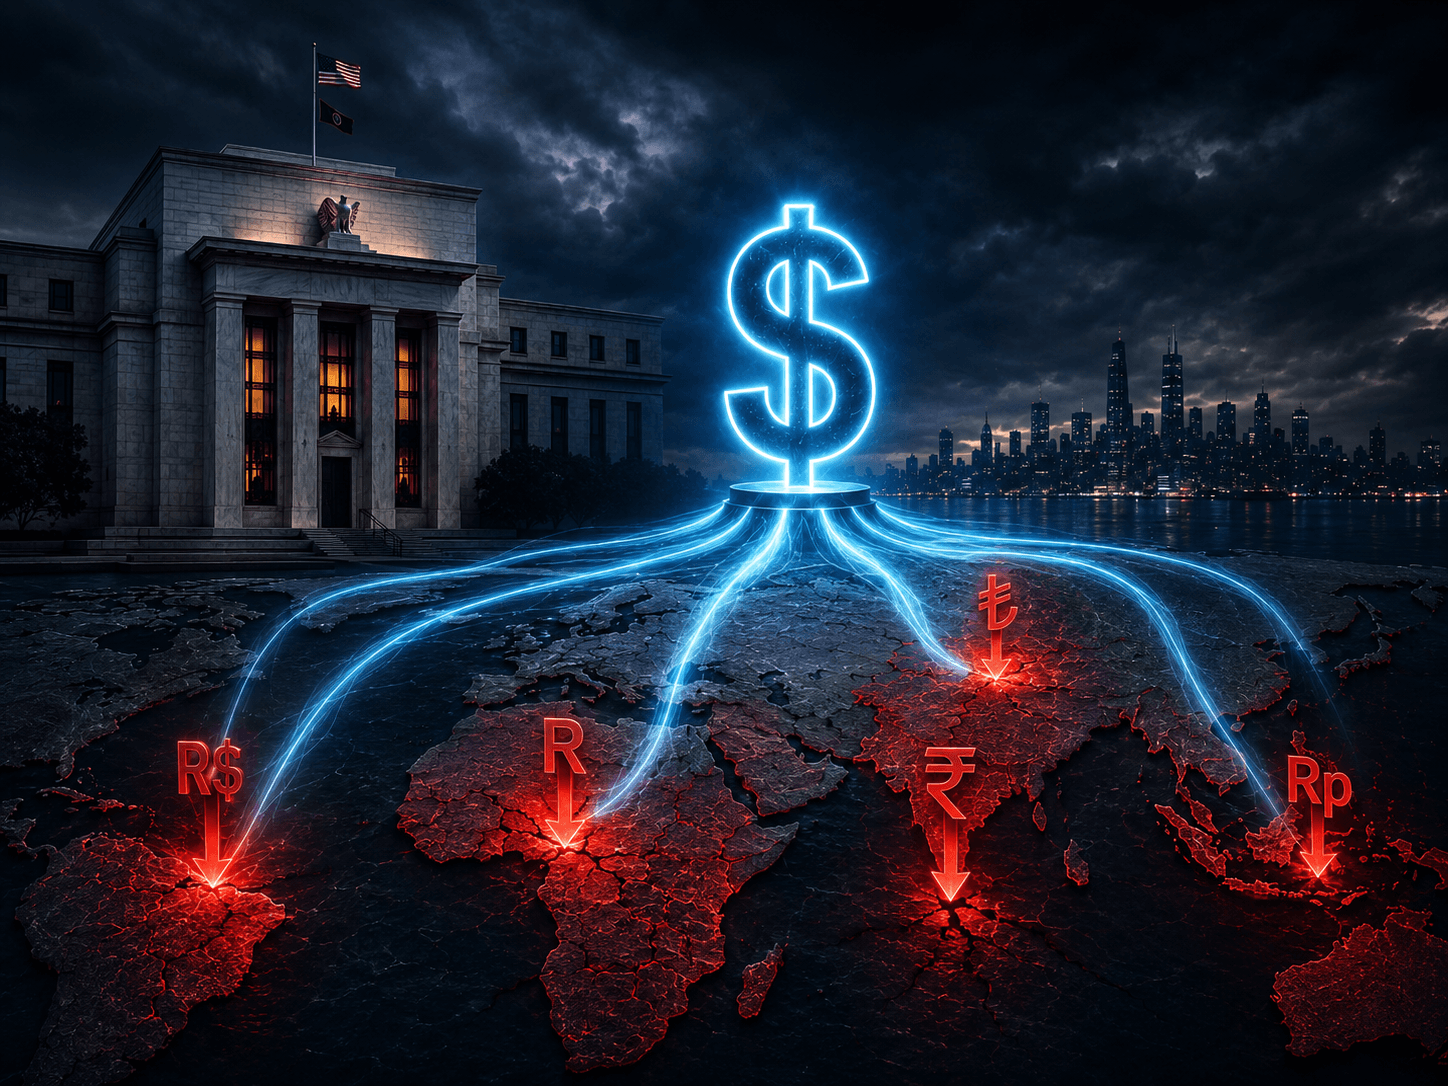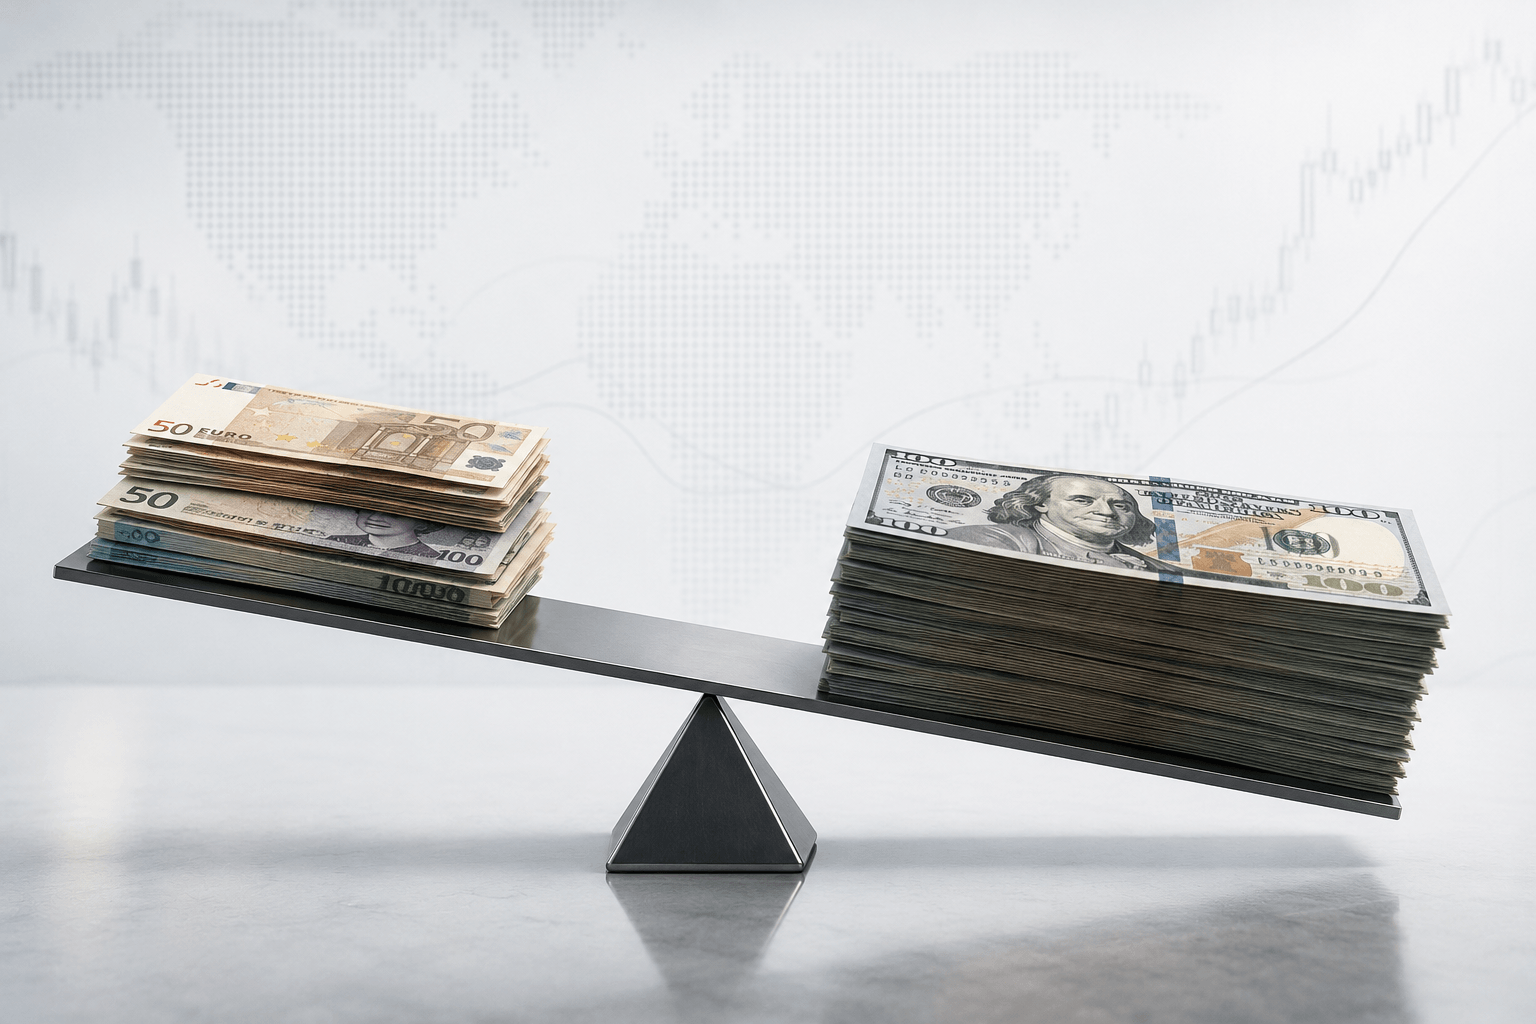



Every quarter, something happens in global currency markets that produces clear, directional price movement with no news headline to explain it. No central bank announcement. No economic data surprise. No geopolitical event. Just sustained, orderly pressure in a specific direction on major currency pairs for several days running. Experienced institutional traders recognise it immediately. Most retail traders attribute it to technicals, momentum, or end-of-quarter noise and move on. What is actually happening is sovereign wealth fund rebalancing, and it is one of the most consistent and most overlooked forces in forex markets.
What sovereign wealth funds are and why their size matters
Sovereign wealth funds are state-owned investment pools. They are funded primarily by commodity revenues, trade surpluses, or central bank reserves, and they are managed on behalf of the nation rather than private investors. The Gulf funds are the most prominent in the region. The Abu Dhabi Investment Authority manages somewhere above eight hundred and fifty billion dollars. The Kuwait Investment Authority, established in 1953, is the world's oldest sovereign fund and manages over seven hundred billion dollars. The Qatar Investment Authority manages over four hundred and fifty billion dollars. Saudi Arabia's Public Investment Fund has grown rapidly and now manages several hundred billion dollars across domestic and international investments.
Globally, sovereign wealth funds collectively manage somewhere above ten trillion dollars. No single private asset manager comes close to that figure. Their size means they cannot trade the way normal investors trade. A decision to shift two percent of a portfolio allocation does not produce a single order. It produces weeks of carefully sequenced transactions, worked through prime brokers and external managers across multiple time zones, designed explicitly to avoid moving the market against themselves before they finish executing.
How rebalancing creates currency flows
Every sovereign wealth fund operates with a target allocation across asset classes. A typical allocation might be sixty percent equities, twenty percent fixed income, and the remainder spread across real estate, infrastructure, and alternatives. Over a quarter, markets move. Equities rally or fall. Bonds perform differently from stocks. The actual portfolio drifts away from the target allocation.
At the end of the quarter, the fund must rebalance. If equities outperformed and the equity weight drifted from sixty to sixty-seven percent, the fund must sell equities and buy underweighted assets to restore the target. The equities being sold are predominantly US equities given their dominance in global indices. The proceeds are dollars. The assets being bought are predominantly in non-dollar currencies. European bonds, Asian equities, infrastructure assets priced in sterling or euros or yen.
The dollar proceeds from US equity sales must be converted into other currencies to buy those assets. This conversion is not driven by any view on the dollar. It is driven by a spreadsheet that says the allocation is wrong and must be corrected. The currency selling that follows is real, it is large, and it repeats every quarter on a predictable schedule.
The timing clusters around the final two weeks of March, June, September, and December. Multiple funds operating on similar quarterly cycles execute similar rebalancing trades at similar times. The cumulative effect on currency markets is a sustained directional bias that can last several days and produce moves that look, from the chart, like a trend with no fundamental explanation.
Norway shows the pattern most clearly
The Norwegian Government Pension Fund is the world's largest sovereign wealth fund at approximately one point seven trillion dollars. It is also the most transparent, publishing detailed quarterly reports that allow outside observers to reconstruct its approximate rebalancing activity.
Norway's fund holds roughly seventy percent equities by policy mandate. After a strong quarter for global equities, the equity weight drifts above seventy percent. The fund sells equities and buys bonds across dozens of markets to restore the balance. The currency conversions involved in those purchases, selling dollars and buying euros, sterling, yen, and other currencies, are large enough to create observable flows in the pairs involved.
Institutional traders who track Norway's quarterly reports use them as a directional proxy for the broader sovereign wealth fund rebalancing flow. Less transparent funds, including the Gulf funds, operate on similar mandate structures and similar timelines. Norway's disclosed activity is the most visible tip of a much larger iceberg.
The Gulf funds and petrodollar recycling
The Abu Dhabi Investment Authority, Kuwait Investment Authority, Qatar Investment Authority, and Saudi Arabia's Public Investment Fund collectively represent several trillion dollars of petrodollar recycling. Oil revenues arrive in dollars. The funds invest those dollars globally across equities, bonds, real estate, infrastructure, and private equity in currencies around the world.
When oil prices are high and revenues are strong, these funds receive larger inflows and invest more. The currency conversions involved in deploying those inflows create buying pressure on the currencies of the markets being targeted. When oil prices fall and revenues shrink, the deployment slows. The currency buying pressure that comes from sovereign fund inflows is one of the structural forces underpinning certain currency pairs and certain markets that has nothing to do with economic data or central bank policy.
For traders based in Dubai, this is not abstract macro context. The funds headquartered in Abu Dhabi, Kuwait City, and Doha are managing capital that came from the same oil revenues that shape the regional economic environment. Understanding how those funds deploy capital globally is understanding a force that operates inside the city's financial ecosystem on a daily basis.
Acquisition-related flows are harder to predict but equally real
Beyond regular rebalancing, sovereign funds make direct investments. A Gulf fund acquiring a stake in a European infrastructure company converts billions from dollars or local currency into euros to close the deal. A fund buying UK commercial real estate converts into sterling. These acquisition flows are not on a quarterly schedule. They happen when the investment decision is made and the deal is completed.
The currency impact is observable in the days before a deal becomes public. Unexplained buying in a specific currency pair, sustained over several days, with no news catalyst, sometimes reflects a sovereign fund building the currency position required for an acquisition that has not yet been announced. When the deal eventually becomes public, the prior currency movement is explained retrospectively. The traders who identified the flow without knowing the reason had already positioned themselves.
What this means for how you trade around quarter-end
The practical implication is straightforward. Quarter-end periods, specifically the final ten to fifteen trading days of March, June, September, and December, produce elevated sovereign fund-linked currency flows. The direction of those flows depends on how equity markets performed during the quarter.
A quarter where US equities outperformed non-US equities typically produces dollar selling and foreign currency buying in the rebalancing period, as funds restore equity allocations by selling US stocks and buying foreign assets. A quarter where US equities underperformed typically reverses the direction.
Mapping quarterly equity performance against expected rebalancing direction gives a structural bias for the quarter-end window that has no equivalent in conventional technical or fundamental analysis. It does not produce precise entry signals. It produces a directional tendency that can be incorporated into trade planning as context.
Checking the economic calendar at the start of each quarter-end month to note what is scheduled alongside the rebalancing window helps separate genuine rebalancing flows from reactions to economic events that happen to coincide with the same period.
Open a free demo account and practice observing currency pair behaviour in the final two weeks of each quarter. Watch how EUR/USD, USD/JPY, and GBP/USD move during the rebalancing window compared to the weeks before and after. Build the habit of connecting quarterly equity performance to expected currency flow direction before real capital is involved in managing those flows.